
Paper digest: Global spread and invasion dynamics of SARS-CoV-2
Published:Today I will be discussing three papers: 1. Dispersal patterns and influence of air travel during the global expansion of SARS-CoV-2 variants of concern published on Cell; 2. Genomic assessment of invasion dynamics of SARS-CoV-2 Omicron BA.1 published on Science; and 3. Establishment and lineage dynamics of the SARS-CoV-2 epidemic in the UK. All use phylogenetic methods to understand the global spread locally introduction events of SARS-CoV-2. I wanted to know how they modelled the importation events using tree model, and this info will facilitate my modelling study on a metapopulation compartmental model.
Establishment and lineage dynamics of the SARS-CoV-2 epidemic in the UK
This paper is the earliest one among the three selected papers, published on Jan 2021. Using large-scale phylogenetic analyses (on 50,887 sequences) combined with epidemiological and travel data, the authors quantified the size, spatiotemporal origins, and persistence of genetically distinct UK transmission lineages.
Introduction
Regional epidemics can be highly dynamic at the genetic level, with recurrent importation and extinction of transmission chains within a given location.
UK experienced one of the largest epidemics worldwide during the first half of 2020.
The data represent genomes from 9.29% of confirmed UK COVID-19 cases by 26 June. Further, using an estimate of the actual size of the UK epidemic, we infer that virus genomes were generated for 0.66% [95% confidence interval (CI), 0.46 to 0.95%] of all UK infections by 5 May.
Results
Genetic structure and lineage dynamics of the UK epidemic from January to June
We first sought to identify and enumerate all independently introduced, genetically distinct chains of infection within the UK. We developed a large-scale molecular clock phylogenetic pipeline to identify “UK transmission lineages” that (i) contain two or more UK genomes and (ii) descend from an ancestral lineage inferred to exist outside of the UK (Fig. 2, A and B).
Figure 2

Transmission lineage diversity and geographic range
UK lineages detected in each region (UK counties) correlates with the number of genomes sequenced and the number of reported cases in each region.
Dynamics of international introduction of transmission lineages
They compare TMRCAs with estimated importation intensity (EII). As TMRCAs and importation dates are two different things (Fig. 2B).
They use the model to impute an importation date for each UK transmission lineage (Fig. 5D).
Useful methods
They developed a new Bayesian molecular clock phylogenetic analysis pipeline in order to reconstruct a posterior set of time-scaled phylogenetic trees for our exceptionally large virus genome dataset.
- we estimated an approximately maximum-likelihood tree using the Jukes-Cantor model in FastTree v2.1.10, then collapsed branch lengths shorter than 5*10^-6 substitutions per site, which corresponded to distances smaller than one substitution across the whole virus genome, and likely result from nucleotide ambiguity codes in the genome sequences.
- Next, we applied a commonly used approach, recently implemented in BEAST 1.10, to convert branches of the large-scale phylogenetic trees from units of substitutions per site to time. This model takes the place of the nucleotide substitution model in a traditional Bayesian molecular clock dating analysis.
- Trees were sampled using MCMC under the model described above with a Skygrid coalescent tree prior using the same grid-points as in the preliminary analysis. A randomly resolved time-calibrated tree estimated in TreeTime was used as the starting tree. To maintain a mapping between the topology in the estimated time-calibrated tree and the input genetic distance tree, we constrained the topologies such that any tree-move that broke a clade present in the input tree was rejected. The resulting MCMC chain, therefore, only samples different polytomy resolutions and branch durations. This approach allowed us to incorporate uncertainty in the polytomy resolutions and branch durations into our molecular clock analysis.
Dispersal patterns and influence of air travel during the global expansion of SARS-CoV-2 variants of concern
The Alpha, Beta, and Gamma SARS-CoV-2 variants of concern (VOCs) co-circulated globally during 2020 and 2021, fueling waves of infections. They were displaced by Delta during a third wave worldwide in 2021, which, in turn, was displaced by Omicron in late 2021. In this study, we use phylogenetic and phylogeographic methods to reconstruct the dispersal patterns of VOCs worldwide. We find that source-sink dynamics varied substantially by VOC and identify countries that acted as global and regional hubs of dissemination.
Introduction
The logic of the introduction section is as follows:
- Different VOCs was associated initially with increasing SARS-CoV-2 incidence in their presumed countries of origin, then being displaced by other VOCs.
- Global transmission continued despite PHSMs and vaccination efforts.
- Understanding the global spread pattern of VOCs is critical. GISAID is helpful.
- We combine phylogenetic models that leverage multiple sets of ~20,000 genomes per VOC from >100 countries with global air passenger data in order to reconstruct the global spread of each VOC.
Results
VOC global dissemination patterns
- To quantify the global dissemination patterns of each VOC, we performed ancestral state reconstruction of discrete spatial locations using dated phylogenetic trees that were inferred from a subset of representative sampled genomes (for which sequence sampling locations were known).
- A limiting factor of this analysis is that countries with under-reported incidence and low sequencing proportions, but high global connectivity would have been missed as important global or regional VOC disseminators (given the reliance of our methods on genomic data and underlying testing patterns).
- It is important to note that due to subsampling and uneven sampling, viral importation numbers presented in this manuscript need to be interpreted as relative measures and will underestimate the actual number of importations. Additionally, country-specific differences in testing rates and sequencing efforts could also introduce potential biases in the estimated numbers of international exports, particularly when testing is low or sequencing intensity is much lower in proportion to recorded cases, where our method would underestimate the numbers of viral imports and exports.
Figure 1. Spatiotemporal dispersal patterns of VOCs
 In Figure 1, mean dates of all viral movements inferred along the routes were draw. The number of exports is inferred from case-sensitive phylogeographic analysis. Also refer to Figure S1.
Quantifying regional and global dissemination hubs
- The share of contributions to international exportations is highly correlated with countries’ total air travel passenger volume.
Figure 2 showed Regional and global dissemination hubs of VOCs.
Role of first-reporting countries in global VOC dispersal
Figure 3. Inferred origins of global VOC dissemination events

Impact of international travel on VOC dispersal
To examine how air travel has influenced the speed of dissemination of VOCs worldwide, we investigated global air travel passenger volumes between February 2020 and March 2022 and the network structure of the global airline network and compared them with the speed of dispersal of VOCs in countries reporting VOCs using genomic data.
Figure 4. Impact of global air travel on VOC dissemination
 The radial distance of each node from the presumed origin location along the connecting branches represents the effective distance $D_{eff}$.
Useful methods
The phylogenetic methods used in this study are highly relevant to my study. Importantly, the inferred the introduction and exportation events based on the ancestral state changes. The ancestral states (locations) were reconstructed based on time scaled phylogenetic tree. Specifically, he mugration package extension of TreeTime was then used to map discrete country locations to tips and infer country locations for internal nodes under a GTR model. Trees were build with NextAlign and FastTree, on subsampled sequences (using subsampler).
They used datasets of approximately 20,000 sequences for each VOC, and repeated the analysis for ten times (ten subsampled datasets).
Genomic assessment of invasion dynamics of SARS-CoV-2 Omicron BA.1
Through a large-scale phylodynamic analysis of 115,622 Omicron BA.1 genomes, we identified >6,000 introductions of the antigenically distinct VOC into England and analyzed their local transmission and dispersal history.
Background
Omicron emergence and Omicron influence on the HK context.
Results
International importation and Omicron BA.1 lineage dynamics
we undertook a large-scale phylodynamic analysis of 115,622 SARS-CoV-2 Omicron genomes, sampled globally between 8 November 2021 and 31 January 2022, with ~42% (n = 48,748) were sampled from England.
All available genomes [from COG-UK and the GISAID on 12 and 9 April 2022, respectively] sampled before 28 November 2021 were included; later genomes were subsampled randomly in proportion to weekly Omicron case incidence while maintaining a ~1:1 ratio between English and non-English samples.
We identified at least 6455 [95% highest posterior density (HPD): 6184 to 6722] independent importation events. Most imports from outside of England [69.9% (95% HPD: 69.0 to 70.7)] led to singletons (i.e., a single genome sampled in England associated with an importation event, which did not lead to observable local transmission in our dataset).
Estimated importation intensity (EII) is again utilized here. The weekly importation intensity is an estimate of the number of Omicron BA.1 cases arriving in England during a given week from a specified source location, calculated by multiplying together the estimated weekly prevalence of Omicron BA.1 at the source location and the number of air passengers arriving in any England airport from the source location.
Human mobility drives spatial expansion and heterogeneity in Omicron BA.1 growth
we reconstructed the dispersal history of all identified transmission lineages (with >4 genomes) using spatially explicit phylogeographic techniques.
Useful methods
Estimated importation intensity of Omicron BA.1 from potential exporters
To validate the robustness of EII, they did a sensitivity test. Basically, they estimated EIIs calculated EIIs for Spain and the United States at the autonomous community- and state-level, respectively, to account for any local (within-country) heterogeneities in Omicron BA.1 prevalence and air traffic volume. And they found that the total EIIs for Spain and the US (after aggregating over all autonomous communities and states, respectively) are consistent with those calculated using national average positivity rates.
Aggregated and anonymised human mobility data
Google map and machine learning.
Phylogenetic analysis and importation analysis
First, the study period was divided into two phases:
- from 21 November 2021 (sample date of the earliest known genome of the Omicron variant in England, sequenced retrospectively) to 28 November 2021. With the relatively few genomes available from the first phase and to account for an increased risk of importations prior to the travel restrictions, all 874 available sequences (from both England and non-England locations) were included.
- from 29 November 2021 to 31 January 2022. Owing to the large number of genome samples collected during the second phase, a downsampling strategy was applied to ensure that the analysis was computationally tractable.
Then subsampled datasets. This downsampling procedure resulted in a dataset of 59,647 global (non-English) sequences. To generate a dataset of English genomes of roughly the same size, 60,000 sequences were randomly sampled from the COG-UK master alignment.
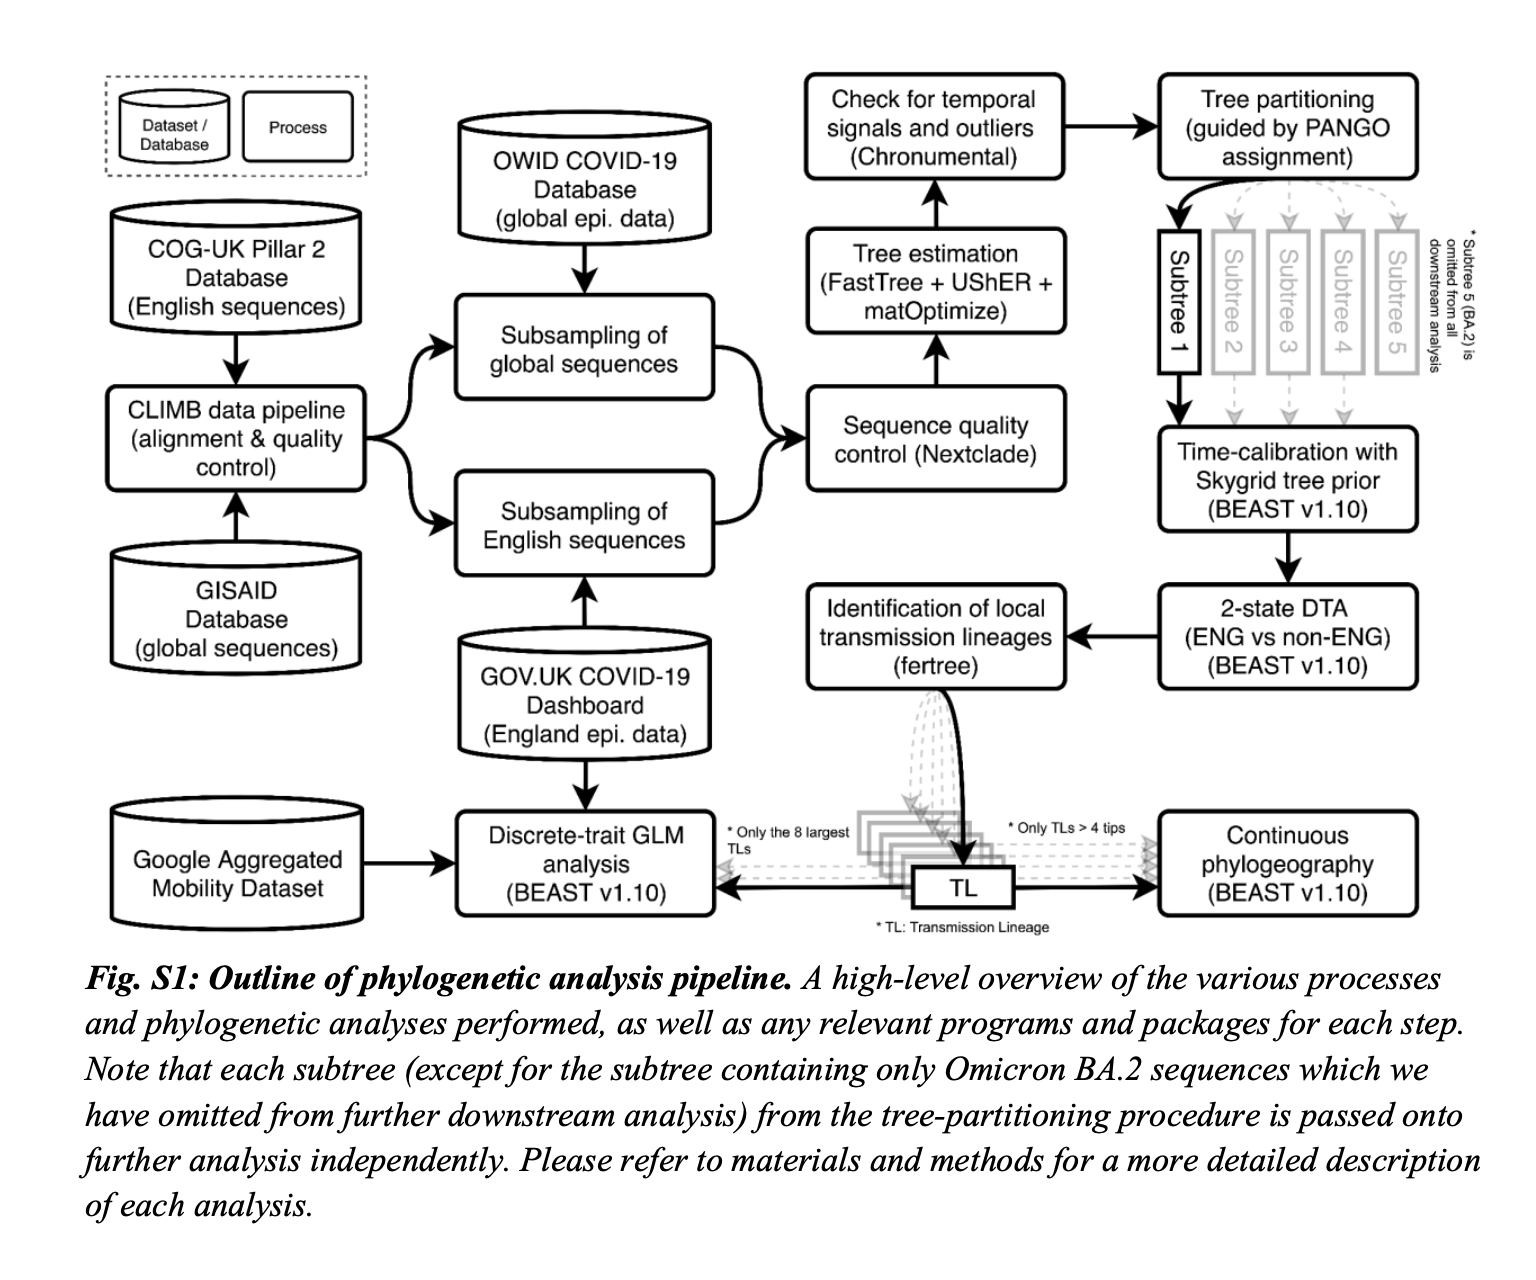
we first estimated a maximum likelihood (ML) tree for the 874 sequences collected during the first phase of the study period using IQTREE with the GTR+G substitution model, rooted with reference genome Wuhan-Hu-1 (GenBank accession MN908947.3) as an outgroup. Five molecular clock outliers were identified and subsequently removed, after examining the root-to-tip regression plot from TreeTime. The resulting tree was then used as a starting tree from which a parsimony tree was estimated by inserting individual sequences sequentially and in chronological order according to sample dates, using the recently developed UShER placement tool. During each step in the iterative process, all sequences sampled on a given date were considered for placement whilst excluding sequences with 5 or more equally parsimonious placements. Sequences excluded in a previous step were appended to the next batch for reconsideration. The resulting tree was then optimised through 6 iterations of matOptimize with SPR radius of 40 and 100 for the first 5 and final iteration respectively. This iterative tree building process resulted in a phylogeny of 115,634 sequences (with 25,921 (18.3%) sequences excluded due to uncertainty in sample placement). Next we used Chronumental (a recently developed time-tree estimation tool for handling large phylogenies) to estimate a randomly resolved time-calibrated tree, with inferred tip dates that maximise the evidence lower bound under a probabilistic model. By comparing the inferred tip dates with sample dates and examining a root-to-tip plot, 12 molecular clock outliers were further removed, resulting in a final phylogeny of 115,622 sequences.
To reconstruct the importation dynamics of Omicron BA.1, we then used a two-state asymmetric discrete trait analysis (DTA) model implemented in BEAST v1.10, using the posterior tree samples estimated above as the empirical tree distributions. For each tree partition, we ran two MCMC chains of 5 million iterations each, resampled every 9,000 states and with the first 10% discarded as burn-in. TreeAnnotator 1.10 (66) was used to generate a maximum clade credibility (MCC) tree for each subtree, in which each internal node is assigned a posterior probability of representing a transmission event in England. Nodes with a posterior probability of >0.5 were identified as introductions; a small number of nodes with ambiguous location assignment (posterior probability = 0.5) were ignored in downstream analyses. To identify the local transmission lineage resulting from each of the introductions, a depth-first search was performed following the same procedure as in du Plessis et al. (2021), where a path starting from e`ach internal node that corresponds to an introduction is traversed forwards in time until a non-England node is encountered or there are no more nodes to be explored. By convention, introductions that led to only a single sampled English sequence were labelled as singletons; only introductions that led to more than one observed local transmission event were labelled as transmission lineages. The time of importation of each transmission lineage was estimated by taking the mid-point between the internal node corresponding to the introduction and its parent.
Tags: Phylogenetics
Categories: Paper digest
Comments